We’ve recently updated our top menu navigation (July 2024). We’re currently updating our user guides to reflect these changes, so thank you for your patience while we work on this. The new menu is user-friendly, so you shouldn’t experience significant disruption. If you need help locating specific items in the new menu however, watch our quick videos for admin users here, and for teachers here.
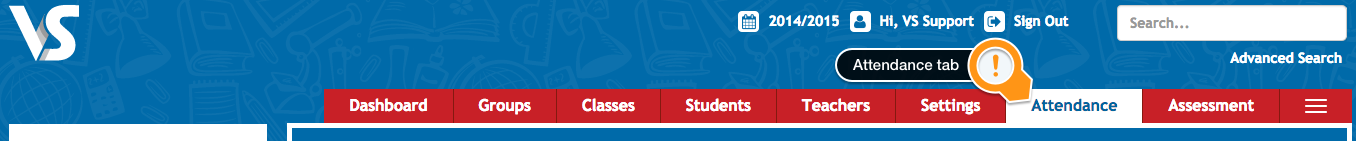
Click the red Attendance tab.
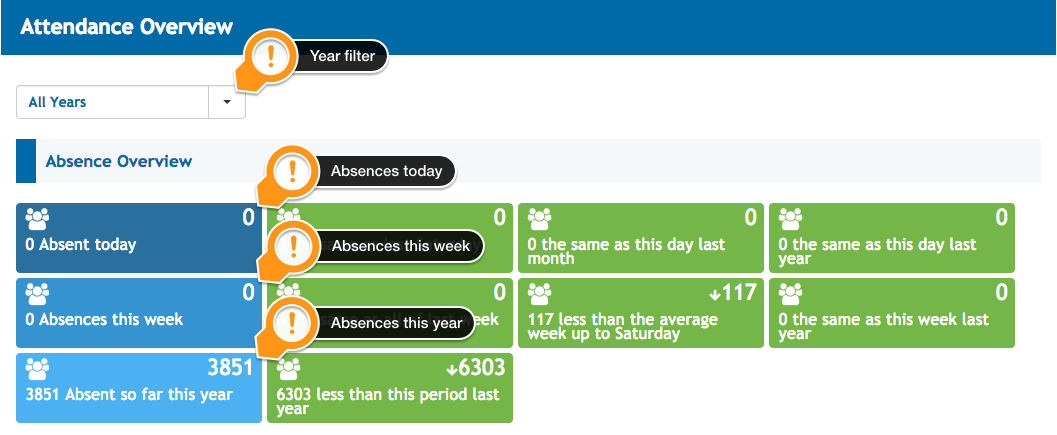
The attendance dashboard presents a series of metrics for absences and lates. Filter on year to change the scope of the report.
The first row of metrics highlights total absences today compared to last week, last month, and last year. A metric will become red if there is an increase in absences compared to the previous period.
The remaining 2 rows compare absences based on a weekly average and on a yearly bases.
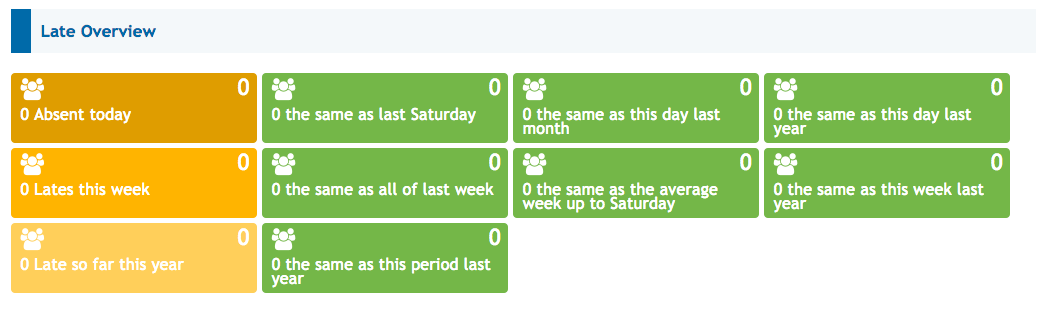
The same analysis is available for late attendance marks.
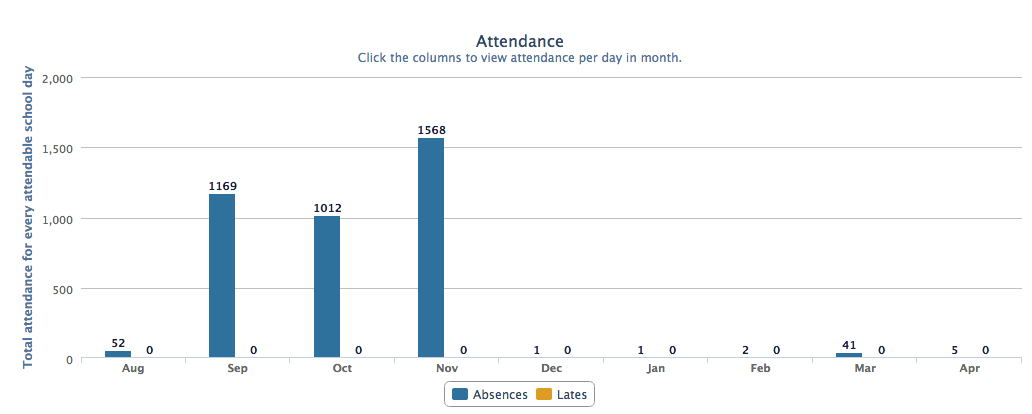
A bar chart also enables schools to view the number of absences graphically per month. Click on a month to expand and zoom in on the exact number of absences across the selected month.