We’ve recently updated our top menu navigation (July 2024). We’re currently updating our user guides to reflect these changes, so thank you for your patience while we work on this. The new menu is user-friendly, so you shouldn’t experience significant disruption. If you need help locating specific items in the new menu however, watch our quick videos for admin users here, and for teachers here.
Last updated 02/03/2023
The subject performance screen takes the old 'Subject Performance' tab and makes it much easier to read, navigate and customise. It allows you to view the performance of selected subjects and compare academic years, base classes and teaching groups.
Note on Assessment permissions:
Secretaries and principal users can see all Assessment reports by default, however teachers can only see the Class Assessment Performance and Subject Performance Report by default.
Subject Performance Report - if a teacher has no additional permissions, they will only be able to see the teaching group version of this report and can only generate reports based on their own teaching groups (rather than by base class). The average of their own classes is also available to them.
If you would like a teacher (for example a teacher with extra responsibility in this area) to be able to have full access these three reports: Term Assessment Performance, Subject Performance and Student Performance, they must be given the permission ‘Allow teacher access to assessment reporting feature’ in Users and Groups. This will give them access to data on all students in the school for all of those reports, not just data of those they teach.
Principal and Secretary View of Subject Performance
- Go to Assessments > Academic performance > Subject performance
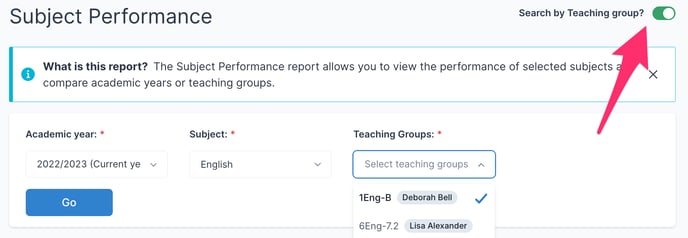
- The default when you enter this screen is to search by each subject by base class. To search instead by teaching group, toggle the 'Search by Teaching Group?' button on, which is found on the top right of the screen.
- Select the relevant year, subject and teaching group or base class, depending on your desired setting.
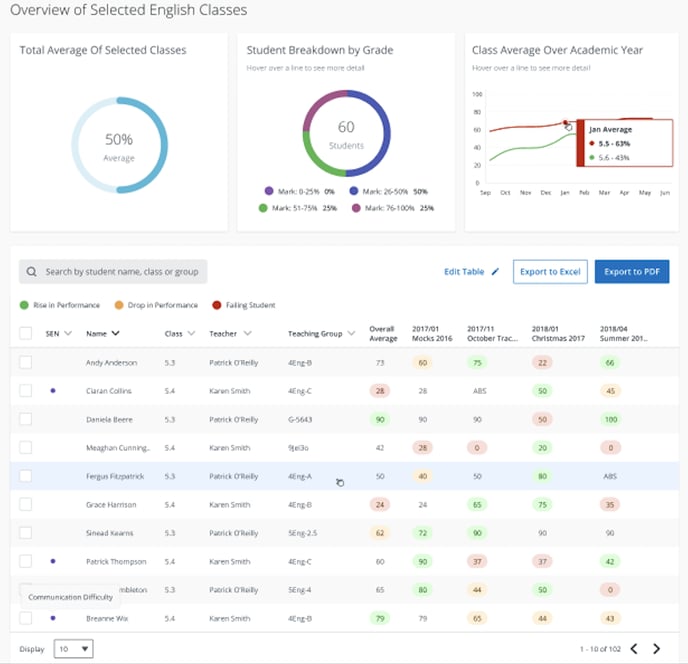
This will give you
- The average of selected classes
- Student breakdown by grade
- Class average over academic year
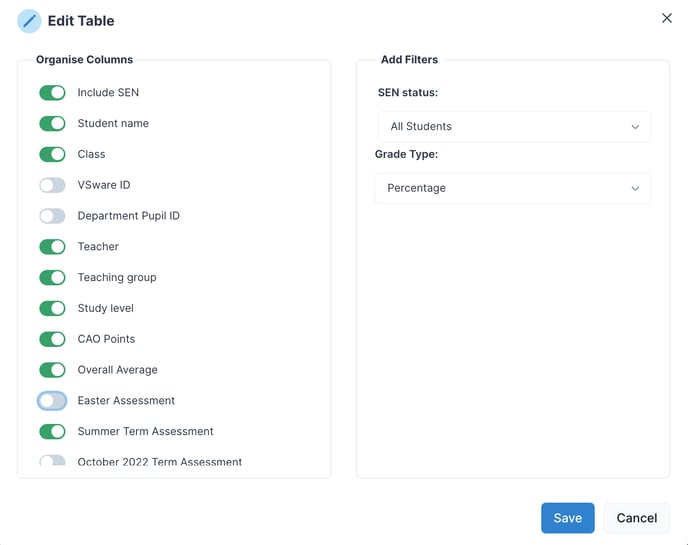
- A table (which you can edit and export) that shows you the performance of individual students those base classes or teaching groups, and their results across the different exams they took. A rise or drop in performance is indicated in green or orange, and red is used to alert you when a student is not reaching the pass grade for that subject. 'Edit Table' on the top right allows you to choose which columns are visible and which can be filtered.
Tips:
You can now search within the Teaching Groups field by teacher's first or surname, or the teaching group name. 
Hovering over the class average graph to see the specific percentage.

The Edit Table button allows you to select select the Term Assessment to be included in the report so you can compare results across different exams. You can also choose the SEN status and the Grade type. The Grade type filter allows you to display a percentage only, or a grade only or both, provided that the exam is set up to include both the grade and the percentage.
If you still have questions, please visit our knowledge base at support.vsware.ie. You can contact our support team via email at support@vsware.ie, via the chat bubble when you are logged into your VSware account or via phone on 01-5549628. Support hours are Mon - Fri, 08:30 - 18:00.